

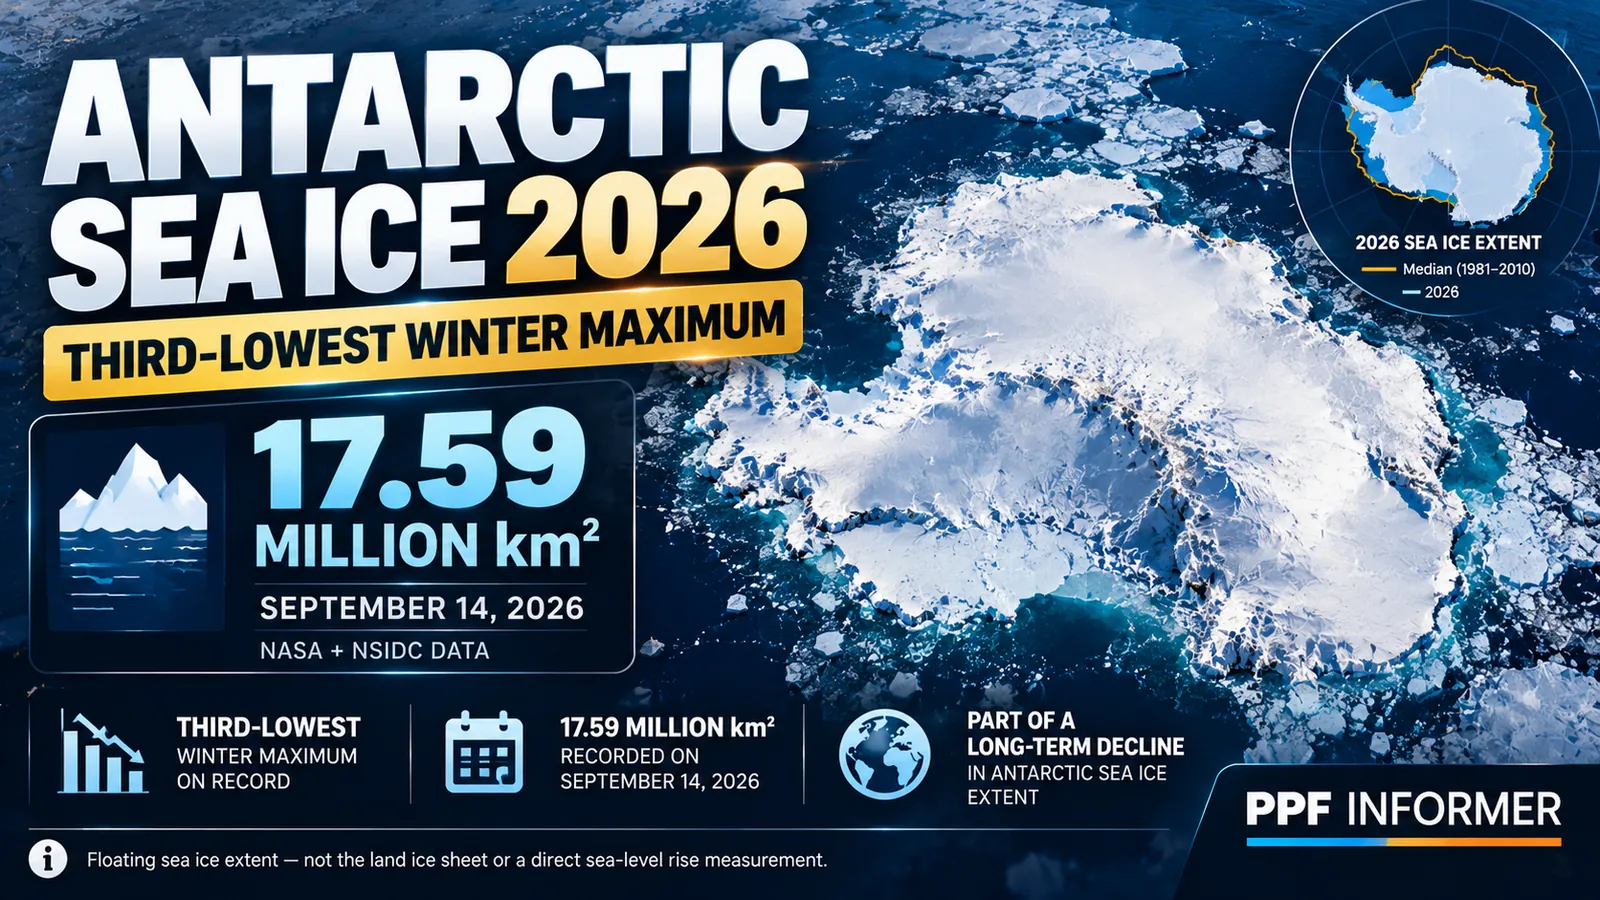
Antarctic sea ice maximum 2026 reached its third-lowest winter maximum in the satellite record, NASA reported on October 12. The ice peaked at an estimated 17.59 million square kilometers on September 14. This finding raises important questions about polar oceans, ecosystems and future climate conditions—but it does not mean that floating sea ice loss directly equals sea-level rise.
Antarctic sea ice maximum 2026: NASA’s findings
The Antarctic sea ice maximum 2026 data, reported by NASA’s Earth Observatory on October 12, showed that Antarctic sea ice reached its likely annual maximum on September 14, 2026. The estimated extent was 17.59 million square kilometers, or 6.79 million square miles. That makes the winter maximum the third lowest in the satellite record that began in the late 1970s.
The number refers to sea ice extent, not the thickness of every ice floe or the amount of ice stored on land. It measures the ocean area where satellites detect at least 15 percent sea ice concentration. Because Antarctica is a continent surrounded by ocean, this floating ice grows outward during the Southern Hemisphere winter and shrinks again as summer approaches.
The announcement is important because several recent Antarctic seasons have had unusually low coverage. However, a single year cannot settle every question about long-term causes or future conditions. Scientists compare repeated observations, weather patterns and ocean measurements before drawing broad conclusions.
Antarctic sea ice maximum 2026: third-lowest explained
For Antarctic sea ice maximum 2026, ice usually expands through winter and reaches its largest extent around September. A maximum is the peak in that seasonal cycle. A low maximum means the winter growth season ended with less ocean area covered by ice than in most years since consistent satellite monitoring began.
For Antarctic sea ice maximum 2026, NASA and the National Snow and Ice Data Center, or NSIDC, identified September 14 as the likely 2026 peak. Scientists initially use cautious language because daily extent can fluctuate with winds and changing weather. Later analysis helps establish whether the date was truly the highest point of the season.
The record includes nearly five decades of satellite observations. Ranking third lowest does not mean Antarctica has only three low-ice years, nor does it mean the entire ice sheet has lost a corresponding fraction of its mass. These are different measurements.
How do satellites measure sea ice?
Researchers use passive microwave sensors to observe natural microwave energy emitted by Earth’s surface. Sea ice and open ocean produce different signals, allowing scientists to estimate ice concentration across large areas. Unlike ordinary photographs, microwave measurements can work through clouds and during the polar darkness of winter.
The satellite record began with instruments on Nimbus-7 in 1978 and continued through several generations of satellites, including the Defense Meteorological Satellite Program and missions carrying advanced microwave sensors. NASA says newer observations include instruments associated with Japan’s GCOM-W satellite.
Scientists process the observations into maps and time series. To make year-to-year comparisons meaningful, they use consistent methods and examine changes when sensors are replaced. No satellite measurement is perfect, so uncertainty and calibration remain part of the research.
The 15 percent concentration threshold is a convention for defining extent. It is useful for comparing broad coverage, but it does not describe how thick or mechanically strong the ice is. An area of thin, scattered floes can count toward extent even when it behaves differently from dense, thick ice.
Why is Antarctica different from the Arctic?
The Arctic is an ocean surrounded by large landmasses, while Antarctica is a continent surrounded by ocean. That geographic difference shapes sea ice. Arctic ice is constrained by coastlines in many places; Antarctic sea ice can expand into open water around the continent.
Antarctic winter ice can spread into relatively warmer latitudes, then melt rapidly as the seasons change. Winds, ocean currents and the position of the sea ice edge can shift dramatically from one year to the next. That makes the Antarctic record more variable in some respects than a simple global warming chart might suggest.
The two polar regions are both affected by changes in climate, but they do not respond identically. It is misleading to use an Antarctic rebound in one season to dismiss Arctic losses, or to assume that an Arctic record predicts the exact Antarctic outcome.
Antarctic sea ice maximum 2026 in the satellite record
NASA notes that Antarctic sea ice extent increased slightly over the earlier part of the satellite record, roughly 1 percent per decade from 1979 to 2014. That pattern differed from the more consistent long-term decline observed in the Arctic. Researchers have investigated how winds, ocean circulation and regional changes may have contributed.
The Antarctic sea ice maximum 2026 followed a period when the earlier increase did not continue. Coverage began showing notable decreases around 2016, and several subsequent seasons have remained below normal. The 2023 season included record-low extremes. The 2026 winter maximum adds another low point to that more recent period.
The scientific challenge is to understand why the pattern changed. A short period of low extent may reflect a combination of climate-driven changes and natural variability. Researchers need longer records, improved ocean measurements and models that reproduce observed conditions to evaluate competing explanations.
That uncertainty should not be turned into a claim that nothing is happening. It means scientists are distinguishing the observation, which is measurable, from the exact attribution and long-term projection, which require further analysis.
What happened after the September 2026 peak?
For Antarctic sea ice maximum 2026, NSIDC’s October 7 analysis said Antarctic extent had declined sharply after the September 14 maximum. The center reported that daily values had reached record lows for the time of year since October 2, compared with its historical series. That is a separate observation from the third-lowest winter maximum.
Post-maximum loss is expected as the Southern Hemisphere moves toward summer. What matters is how quickly and where the retreat occurs relative to the historical range. NSIDC identified notable loss in regions including the Ross and Amundsen seas and parts of the Indian Ocean sector.
Readers should be careful not to interpret a single day’s record as a permanent new state. Daily values are influenced by storms and shifting winds. The significance grows when anomalies persist across seasons or appear alongside related changes in ocean temperature and ice thickness.
Does melting sea ice directly raise sea levels?
Floating sea ice is already displacing water, so its melting does not raise sea level in the same direct way as melting land ice. This is a crucial distinction that is often lost in headlines about Antarctica. The continent’s land-based ice sheet and its surrounding floating sea ice have different roles.
That does not make sea ice unimportant. Floating ice influences the exchange of heat and moisture between the ocean and atmosphere. Its presence can affect waves and coastal conditions near ice shelves. Changes in sea ice may also alter conditions around the edges of the much larger Antarctic ice sheet.
Sea-level projections depend heavily on how land ice responds over time. A third-lowest sea ice maximum is a reason to investigate related processes, not a basis for announcing a specific future rise in inches or centimeters. Such numbers require separate ice-sheet and ocean studies.
Why does sea ice matter for wildlife and ecosystems?
Sea ice provides habitat and feeding conditions for species that depend on the polar marine environment. Its seasonal growth and retreat influence where organisms live, how they access food and when biological activity occurs. Changes in timing can matter as much as changes in total extent.
Different species and regions respond differently. A broad Antarctic average cannot describe conditions at every penguin colony or in every part of the Southern Ocean. Scientists need local observations of ice timing, prey availability and breeding success to understand ecological consequences.
Less ice may increase access to open water in some places while removing stable platforms or changing food-web conditions elsewhere. It would be inaccurate to claim that all Antarctic wildlife is affected in the same way or that a particular population decline has been proved by the 2026 extent measurement alone.
What does lower sea ice mean for ocean and weather research?
Sea ice acts as a changing boundary between the atmosphere and ocean. When open water replaces ice, more direct heat and moisture exchange can occur. That can influence local temperatures, cloud formation and the movement of energy through the Southern Ocean.
Formation and melting of sea ice also affect ocean salinity and the movement of water masses. When seawater freezes, salt is largely excluded from the ice, making nearby water saltier and sometimes denser. When ice melts, freshwater can alter the upper ocean’s structure. These processes help scientists study larger-scale ocean circulation.
The effects are complex and depend on location, season and other conditions. A simplified statement that less sea ice automatically causes a specific storm or a single global weather event would go beyond what the new NASA report establishes.
What can the 2026 observations tell us about the future?
The strongest conclusion from Antarctic sea ice maximum 2026 is that the recent Antarctic sea ice record contains repeated low-coverage years, including the third-lowest winter maximum in 2026. This increases the importance of testing whether ocean warming, atmospheric circulation or other changes are shifting the region’s baseline conditions.
Researchers can compare the 2026 season with earlier extremes, use improved satellite records and deploy instruments that measure ocean heat, salinity and ice thickness. They can also evaluate whether climate models capture the regional patterns that satellites observe.
Forecasting exact Antarctic sea ice extent years in advance remains difficult. A credible outlook should express uncertainty and distinguish short-term seasonal forecasts from long-term climate projections. It should also avoid treating one rebound or one record as proof that every model is right or wrong.
For policymakers and coastal communities, the value of this research is indirect but real. Better knowledge of polar processes can improve assessments of climate risk and the behavior of ice shelves and the Antarctic ice sheet.
What are the limits of the satellite record?
The continuous satellite series reaches back to the late 1970s, which is long enough to reveal important changes but short compared with many natural climate cycles. Earlier conditions must be reconstructed using other evidence, such as historical observations and climate proxies, which have their own uncertainties.
Extent also cannot replace measurements of thickness, volume, snow cover or the movement of ice. A season with relatively broad thin ice might look different in an extent chart than in a volume estimate. The same is true for the difference between mobile sea ice and land-attached ice.
Scientists therefore use multiple observing systems and publish methods alongside results. A responsible interpretation should describe what was measured and avoid turning one indicator into a complete description of the polar environment.
How can readers follow the next Antarctic season?
NASA Earth Observatory publishes accessible satellite maps and explanations. NSIDC provides daily sea ice graphics, monthly analysis and longer-term comparisons. Readers can follow both to understand whether the rapid retreat after the 2026 maximum continues and how it compares with previous years.
Look for the date of the measurement, the reference period used for the average and whether a result is described as preliminary. Charts with different baselines can appear contradictory even when they are not. It also helps to distinguish an Antarctic maximum from an Arctic minimum, because these occur around the same time of year but describe opposite seasonal phases.
A good future update will explain not just a new rank but also the regional patterns and the evidence scientists have gathered about possible causes.
Frequently asked questions
When did Antarctic sea ice peak in 2026? NASA and NSIDC identified September 14 as the likely annual maximum.
How much sea ice was recorded? About 17.59 million square kilometers, or 6.79 million square miles, of extent.
Was this the lowest ever? No. NASA described it as the third-lowest winter maximum in the satellite record.
Does the number measure Antarctica’s land ice? No. It measures floating sea ice extent around the continent.
Does this prove a specific sea-level rise? No. Sea-level change requires separate analysis of land ice, ocean conditions and other factors.
Bottom line
Antarctic sea ice maximum 2026 was the third-lowest winter maximum on record, according to NASA’s October 12 report. The measurement is a significant part of a recent pattern of low coverage, but it should not be confused with land-ice loss or a direct sea-level forecast. Continued satellite observations and ocean research will help explain what the pattern means for the years ahead.
For another recent NASA mission and its scientific goals, read our NASA Space Reactor-1 Freedom 2026 report. That proposed spacecraft mission is separate from the Antarctic climate satellite record.
Primary sources: NASA Earth Observatory, October 12, 2026; NSIDC’s September assessment; NSIDC’s October 7 analysis.